

My Recent Actions & Undervalued Compounders
Disclaimer: Do your own due dilligence. This is not investing advise.

Not been a lot to write about so I’ve mostly stayed quiet.
Option volatility has drained out of the few companies I wanted and the few names that were undervalued + had good option volatility has more or less petered out. I wasn’t interested in underwriting risk at prices I felt were exorbitant so I’m moving on.
Recent Sells: Occidental Petroleum (Profit: +1.8%)
OXY 0.00%↑ : Sold. 900 shares. Forcibly called at $62.22 against average of $61.09. Did not re-enter. Might enter closer to $50 again. I don’t think this is as attractive now compared to other opportunities.
Unlike Uncle Warren, I do not have the enjoyable disadvantage of billions waiting in the sidelines to deploy.
Still a fine investment. Just think there’s better ideas out there.
Moving on.
Recent Buys:
British American Tobacco (BTI 0.00%↑ )
Fortinet
MSCI
British American Tobacco
Average purchase price: $31.02.
Style: Mean reversion.
Thought Process:
Generated approx $10.9B of free cash flow ttm against an enterprise value of $115b. so its trading approx 8-9% ev/fcf, or about 11 years to “payoff” the investment. Given near 10% tax-free yields, it’s more like 10 years to payoff.
It’s stake in ITC, India Tobacco Company is worth approx $17-$18bn. Subtract this stake and BTI 0.00%↑ trades for around 11-12% free cash flow yield. If we account for this valuation, BTI will take approx 8-9 years to pay off as an investment.
Whilst holding shares, Singapore residents get to enjoy a near 10% tax free dividend yield since the company is domiciled in London.
Ciggarettes are going through high single digit decline. I anticipate in 30 years that ciggarettes might be 40% to 50% of what it is now but that it will still exist. Vaping otoh might be much more prevalent. It’s already pretty prevalent right now. It’s smokeless nature and reduced risk might even see more uptake. There’s pros and cons.
For a good writeup, I’d reference the excellent article by the good folks at Eagle Point Capital. He has referenced more authors. To subscribe or not is up to you. I have not and found the argument compelling either way.
Fortinet
Average purchase price: $67.34
Style: Mean reversion (ie; META 0.00%↑ at $88.)
Thought Process:
FTNT’s current PE ratio of 46.66 versus its 3 year average of 63.41 or its 5 year average of 55.88 represent a discount.
FTNT’s moat is well-known to those who follow the business. As a leader in the security space with solutions ranging from network security firewalls to security operations, Fortinet’s moat is derived from switching costs.
IT teams are often reluctant to rip out security hardware/software stacks when the ultimate end goal is to protect the company’s cyber health. Cost is not a factor until it becomes obscene.
Switching from one provider to another is not a simple matter. For any organisation of significant size, swithching is a full time project requiring investment, long term efforts from multiple departments and a sizable chunk of time from the CTO whilst the firm still has to keep its cybergates up and running. This means swithcing requires not just 10-15x cost improvements but more like 30x-50x cost improvements at most larger companies. This is unlikely to be a gulf that can be easily crossed for most competitors.
MSCI Inc.
Average purchase price: $555.91
Style: Mean reversion (ie; META 0.00%↑ at $88.)
Thought Process:
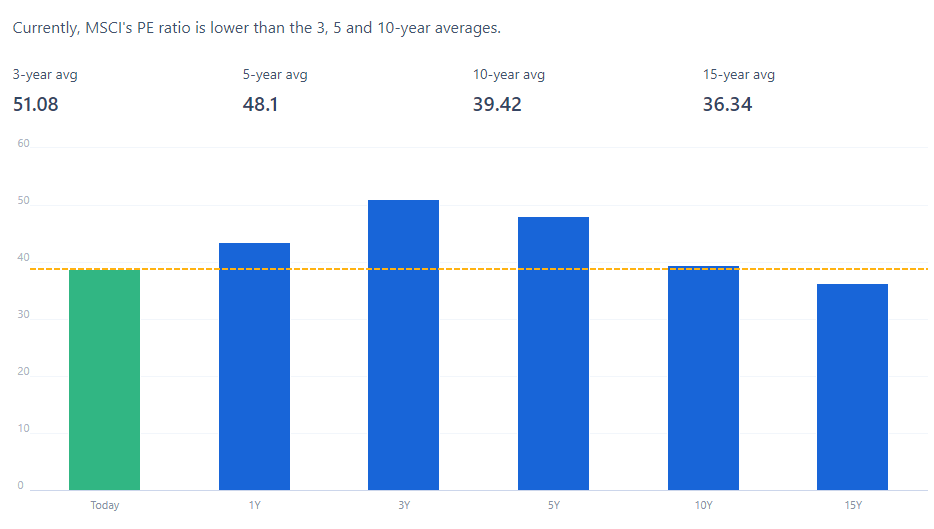
Today, MSCI’s price to earnings ratio is 38.78 versus a 5 year average of 48.1.
If you look at long term revenue, gross profit and net income, it’s all upwards and to the right.

Same for free cash flow per share growth.
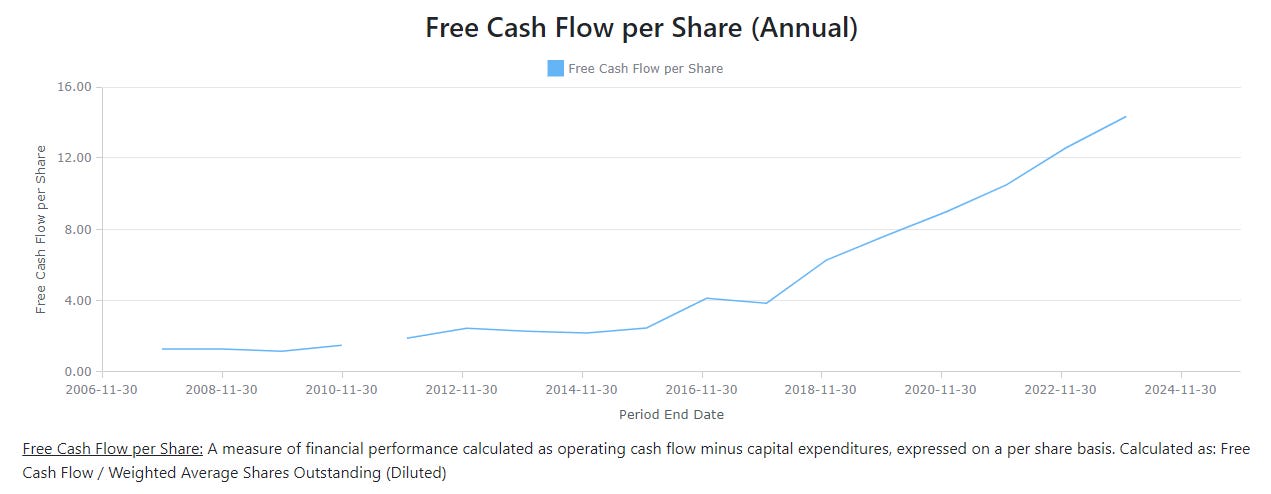
I have thus far established that (1) its kind of cheap in historical context, (2) its long term free cash flow growth is the cascading effect of long term growth in revenues, gross profits, net incomes and gross/net margins.
But there are three further questions for long term share ownership of high quality companies:
Why does the company have a moat?
MSCI’s moat type: Intangibles & Switching Costs
Business type: MSCI has described its mission as enabling investors to build better portfolios for a better world. MSCI’s largest and most profitable segment is its index segment, where it provides benchmarking to asset managers and asset owners. In addition, it boasts over $1.4 trillion in ETF assets linked to MSCI indexes. The MSCI analytics segment provides portfolio management and risk management analytics software to asset managers and asset owners. MSCI’s all other segment was broken out into ESG and climate and private assets segments in 2021. In ESG and climate, MSCI provides ESG data to the investment industry. In private assets, MSCI provides real restate reporting, market data, benchmarking, and analytics to investors and real estate managers.
Moat: types:
Intangibles & Switching Costs
Per Morningstar: “Active asset managers pay to benchmark performance against an index. Index benchmarks are critical to asset owners, asset managers, and consultants, which often have little incentive to switch benchmarks. Once an index becomes dominant in a segment, it tends to stay that way. An asset manager may prefer to be indexed against an S&P emerging-markets index, for example, but if asset owners and consultants prefer the MSCI Emerging Markets Index, the asset manager would risk outflows.”
In short, its high risk to randomly switch providers, though it can be done, and doing so is something unlikely when costs remain low, ultimately however, MSCI’s performance did not shatter even when Vanguard switched out in 2012.
Per Scuttleblurb: “Switching index providers entails transaction costs and capital gains events as well as the possibility of AUM losses, so ETF managers don’t do so frivolously…In the past, Russell, S&P, and NASDAQ, in their attempts to build international index franchises, tried undercutting MSCI on price.
Vanguard’s 2012 decision to transition $131bn of AUM across 22 ETFs from MSCI to Russell is the only major index switch that I can think of and even this ostensibly calamitous loss – $131bn was nearly 40% of the ETF AUM linked to MSCI indices at the end of 2012 – has been rendered nothing more than blip by subsequent inflows and market appreciation:

How long can that moat last (in very rough numbers and within reason)?
It’s hard to guess but given the length of time its been around - I’d say at least another 30-40 years. Standards and benchmarks as a concept are as eternal as concepts get. Mankind has established standards as a point for quite awhile and that is unlikely to change. But standard quality does change and standard types do change and so I think the more pertinent question is: will MSCI be able to over time, extend its moat, extend the number of people who want to use its benchmarking, analytics, and other services? If the answer to that is yes, then the answer to the length of time can be clearer.
Will its moat widen or lessen overtime?
Logically - I’d say that it extends over time. Just as excel, qwerty keyboards, and elevators / escalators have remained in place for a very long time, high-level widely accepted standards tend to stick around simply because everyone tends to benchmark around it (in the same way everyone tends to use excel/qwerty keyboards) and its painful/exorbitant to switch away. That behaviour and habit tends to deepen / get firmer over time and it takes monumental shifts in attitude / environment to change. That Vanguard did so in 2012 is more in line with its value philosophy of being “THE LOW COST ETF PROVIDER” rather than any other aspect. In my view, as long as MSCI is able to remain a small part of the asset provider’s overall expenses while retaining its competitiveness and need as a benchmark, there isn’t much reason to fret.

Summary, TL/DR - A Bonus Company
**Do your own due dilligence. I am in now way responsible for your lossess, or gains.
In sum, I own shares and call options on BTI 0.00%↑
I own shares FTNT 0.00%↑
I own shares MSCI 0.00%↑
I also own shares of Medical Facilities Corporation.
Thought process: In the book, The Outsiders: Eight Unconventional CEOs and Their Radically Rational Blueprint for Success, William Thorndike outlines a few CEOs who through then unheard of or rare methods, rapidly enhanced the values of the companies they stewarded - often for staggering compound return rates.
General Dynamics for example, through selling off non-core assets and streamlining of operations gained over $5 billion in cash proceeds against a market cap of then $10 billion.
The pattern here in Medical Facilities Corporation is similar. In September 2022, the company announced that MFC planned to:
MFC plans to suspend acquisitions
divest its non-core assets
pursue overhead cost reductions,
evaluate and implement strategies to return capital to its shareholders —> including the commencement of a substantial issuer bid
Per its 2022 annual report available here, that same year, the co bought back 16% of its total shares, for a total consideration of
approximately $38 million.
Share repurchases are still ongoing and divestitures of non-core assets are still ongoing:
The company can still repurchase up to 10% of its total float between now and Nov 30, 2024 per their repurchase program.
Shares now trade at 4.95x free cash flow or abt 10x earnings.
The underlying business of owning top hospitals for key selective surgeries will continue to do well going into the future and is unlikely to be displaced as part of a health ecosystem.